
Archived Articles
Are “Many Various Minerals” Present
At Shallow Depth Beneath Bimini?
At Shallow Depth Beneath Bimini?
Testing The Validity of Edgar Cayce Reading 996-12
Part 2
By William Hutton and Jonathan Eagle
In Part 1 of this article we covered some of the background behind our previous explorations and geomagnetic survey of Bimini, Bahamas. We discussed the rationale behind our using the survey techniques we used. In this part we continue with a geochemical analysis of the shallow subsurface soil in an attempt to find further evidence of the mineralized vein discussed in Edgar Cayce reading 996-12.
MMI Geochemical Survey On Land and Under Water, In The Inlet Area
MMI analysis. A procedure known as Mobile Metal Ion (MMI) analysis has been used in recent years to detect the presence of metal mineralizations hidden by overburden. Its application in prospecting for precious metals, nickel, and copper has become a routine geochemical survey procedure in various parts of the world.
A review paper1 entitled “Finding deeply buried deposits using geochemistry,” covers the theoretical and experimental framework for the movement of material from deeply buried deposits to the surface. The research paper also reviews field studies at sites in which MMI analysis was used. Our guidance as to sampling and analytical protocols, however, came from articles like those published in the Journal of Geochemical Exploration2 or in the WAMTECH MMI Process Information Manual.
The basic idea behind MMI analysis is that metal ions are capable of moving upwards from their origin in a buried mineralized zone to the surface by processes of diffusion and/or advection into water and gases in the environment. That is, minerals dissolved in water may migrate within the water mass – diffusion, or may migrate as part of a moving air or water mass – advection. Diffusion may also occur as a result of chemical or electrical gradients. Advection may occur by barometric pumping of gases or by groundwater flow.
One Exploration Company's View of MMI Theory. A company called MMI Technology has presented its description of the theory of the origin of MMIs.
Mobile Metal Ions is a term used to describe ions, which have moved in the weathering zone and that are only weakly or loosely attached to surface soil particles. It is a widely held belief that these Mobile Metal Ions are transported from deeply-buried ore bodies to the surface. Scientists from around the world have been studying this phenomenon for many years.
No one is completely clear on exactly how the metal ions migrate to the surface. However, research and case studies over known ore-bodies have shown that mobile metal ions accumulate in surface soils above mineralization, indicating that the metals are derived from the mineralization source.
As the ions reach the surface, they attach themselves weakly to the soil particles. These are the ions that are measured by the MMI Technique to find mineralization at depths. The weakly attached ions are at very low concentrations. Because the ions have recently arrived to the surface they provide a precise ‘signal' on where the ore-bodies are.
When the mobile metal ions have arrived at the surface they have a limited lifetime as ‘mobile' ions. At the surface the ions are subject to weathering and are bound up by soil forming processes (i.e. they become part of the soil).
By only measuring the mobile metal ions in the surface soils, MMI Geochemistry will produce very sharp responses (anomalies) directly over the source of mobile ions. This source is ore-bodies at depth, which emit metal ions, which make up that ore-body. For example a Cu, Pb, Zn base metal deposit will emit (release) Cu, Pb and Zn ions.
Laboratory analysis. In the laboratory, MMIs in a field sample are extracted by use of acid(s) or by selected ligands that specifically complex with and change the solvation energy status of the metal ions being sought. Successful MMI analysis requires a solution with a low-interference matrix for aspiration into inductively-coupled plasma (ICP) instrumentation attached to a mass spectrometer to provide sub parts-per-billion (ppb) ion determinations. Sample sites. As shown on the map of Figure 6, a total of 28 sample sites were visited, and 30 samples were taken. The sampling locations were meant to cover as much of the magnetic trend as possible, within our available budget. We chose sample site number B18 as the place to take a control sample, one presumably uncontaminated by the other samples that might show MMI concentrations representative of the mineralized zone. In retrospect, we should probably have taken a control sample farther out on the Great Bahama Bank because the ebb and flood tidal currents in the lagoon, where we took sample B18, render the entire lagoon an “open system;” that is, a system subject to contamination from the inlet area itself. Sample site “B50” yielded three samples obtained by diving three times at slightly different elevations on rock outcrops in the bottom of the inlet channel.
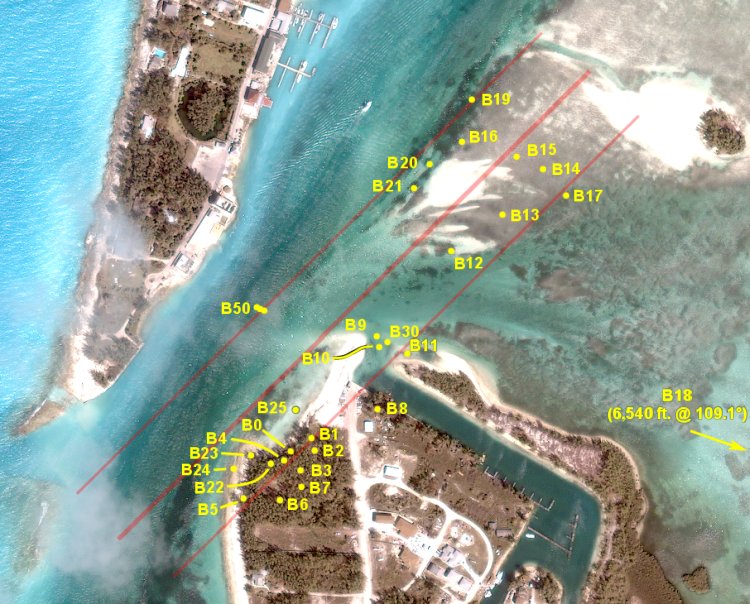 Fig. 6 - Locations of sample sites plotted on a satellite map of the Bimini Inlet area. Boundaries of the possible mineralized zone shown by red lines.
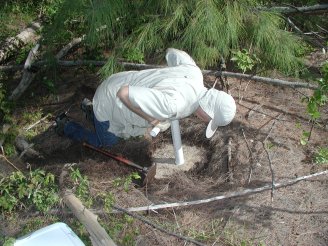
 Sampling procedure. A sampling device was constructed from standard PVC plumber's pipe. The cone we fabricated was sanded so that it would not bind seriously during insertion of the cone and core barrel into the soil or sediment. All samples were recovered by simply pushing the sampling device as far into the soil or sediment as desired.
Upon insertion to a selected depth of between 6 and 20 inches, the person doing the sampling would dig down along the side of the barrel to the bottom and slide a semi-rigid piece of rubber across the rim of the cone. He would then lift the entire apparatus out of the sediment and carry it to a plastic box in the boat (or on land). At that point, one person would hold the outside of the core nose down tightly on the box, while the other would twist the core barrel and lift. Excess sediment or soil in the core barrel would fall into the box for later disposal. The 5-inch long sample in the core nose would then be released into a pre-labeled, zip-lock plastic bag for storage.
Sampling Procedures and Instruments
 |
 |
|
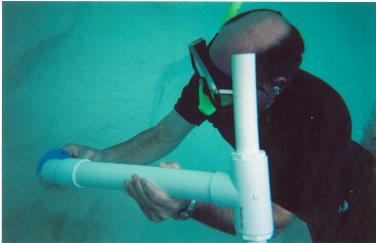
| Taking a core sample on land | Taking a core sample in lagoon waters |
 |
 |
|
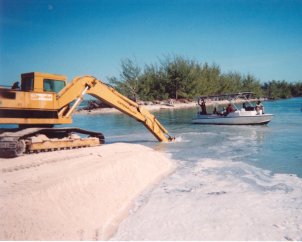
| Returning a deep-water sample to the surface | Articulated-arm shovel sampling the coquina off of the South Bimini Taxi Dock |
Several samples were recovered without difficulty from underwater locations. A few samples were of emerged and submerged, in-place beach rock. Sample B30 was dug from a coquina ledge located 11 ft below mean sea level, by the operator of a back hoe that just happened to be clearing a sand-choked turning basin when we walked through the area.
The age of the coquina (B30) is assumed to be around 4,100 calendar years B.P. as determined from Figure 1. The approximate age of B50 around 5,000 B.P. The approximate time of submergence of the mineralized vein is 7,500 B.P.
Because we were interested in demonstrating only presence or absence of MMIs from a mineralized zone, rather than absolute MMI values from site to site, we did not perform acid washes of the sampling equipment after each field sample was taken. We had, however, carefully cleaned the PVC pipe, scoop, and other plastic ware used before the sampling program began. Clean-up between sampling sites was done by plunging the plastic ware into sea water or, on land, by tapping the ware until all soil particles appeared to have fallen off.
Table 1 gives the GPS locations of the 30 samples taken, the GPS way points, and field notes for most locations.
|
Table 1. GPS locations of the 30 samples taken, the way points, and field notes for most locations. |
|||||||||||
| Latitude | Longitude | ||||||||||
| Sample # | Wpt # | Deg | Min | Sec | Deg | Min | Sec |
Remarks |
|||
| B00 | 4 | N | 25 | 43 | 5.3 | W | 79 | 17 | 57.2 | Eroded side of a dune, S. Bimini | |
| B01 | 5 | N | 25 | 43 | 5.8 | W | 79 | 17 | 56.4 | ||
| B02 | 6 | N | 25 | 43 | 5.3 | W | 79 | 17 | 56.1 | Hole of uprooted tree | |
| B03 | 7 | N | 25 | 43 | 4.5 | W | 79 | 17 | 56.8 | ||
| B04 | 8 | N | 25 | 43 | 4.9 | W | 79 | 17 | 57.5 | Between 2 trees | |
| B05 | 9 | N | 25 | 43 | 3.4 | W | 79 | 17 | 59.3 | Base of big tree on beach | |
| B06 | 10 | N | 25 | 43 | 3.3 | W | 79 | 17 | 57.7 | ||
| B07 | 11 | N | 25 | 43 | 3.9 | W | 79 | 17 | 56.7 | Near bulldozer clearing | |
| B08 | 12 | N | 25 | 43 | 6.8 | W | 79 | 17 | 53.4 | Taxi dock area | |
| B09 | 15 | N | 25 | 43 | 9.7 | W | 79 | 17 | 53.4 | Tip of point, Taxi Dock area | |
| B10 | 16 | N | 25 | 43 | 9.4 | W | 79 | 17 | 53.3 | Dredge spoil pile | |
| B11 | 17 | N | 25 | 43 | 9.0 | W | 79 | 17 | 52.1 | Near shore | |
| B12 | 18 | N | 25 | 43 | 13.1 | W | 79 | 17 | 50.1 | Shoal | |
| B13 | 19 | N | 25 | 43 | 14.5 | W | 79 | 17 | 47.9 | Shoal | |
| B14 | 20 | N | 25 | 43 | 16.1 | W | 79 | 17 | 46.0 | Shoal | |
| B15 | 21 | N | 25 | 43 | 16.7 | W | 79 | 17 | 47.3 | Shoal | |
| B16 | 22 | N | 25 | 43 | 17.3 | W | 79 | 17 | 49.7 | West end of lagoon shoal | |
| B17 | 23 | N | 25 | 43 | 15.1 | W | 79 | 17 | 45.1 | South side of shoal | |
| B19 | 25 | N | 25 | 43 | 19.0 | W | 79 | 17 | 49.2 | ||
| B20 | 26 | N | 25 | 43 | 16.4 | W | 79 | 17 | 51.0 | ||
| B21 | 27 | N | 25 | 43 | 15.6 | W | 79 | 17 | 51.8 | ||
| B22 | 28 | N | 25 | 43 | 4.8 | W | 79 | 17 | 58.1 | ||
| B23 | 29 | N | 25 | 43 | 5.1 | W | 79 | 17 | 58.9 | Beach rock | |
| B24 | 30 | N | 25 | 43 | 4.5 | W | 79 | 17 | 59.6 | Beach rock | |
| B25 | C018 | N | 25 | 43 | 6.9 | W | 79 | 17 | 57.0 | Shallows | |
| B30 | 31 | N | 25 | 43 | 9.4 | W | 79 | 17 | 53.1 | Back-hoe 10-12' below tide (coquina) | |
| B50A | 14 | N | 25 | 43 | 10.9 | W | 79 | 17 | 58.8 | Center line Entrance Channel in-situ beach rock | |
| B50B | 14 | N | 25 | 43 | 10.9 | W | 79 | 17 | 58.8 | Center line Entrance Channel in-situ beach rock | |
| B50C | 14 | N | 25 | 43 | 10.9 | W | 79 | 17 | 58.8 | Center line Entrance Channel in-situ beach rock | |
| Control | 24 | N | 25 | 42 | 44.7 | W | 79 | 16 | 38.6 | Control sample far out in lagoon | |
| Datum: WGS 84 | |
||||||||||
MMI and Trace-Element Analysis of Samples Taken
The analytical work described below was accomplished by the Laboratory for Isotope and Trace Element Research at Old Dominion University, Norfolk, Virginia. Of the 32 elements determined (Table 3) by the ICP-MS methodology, many are rare-earth elements (REE). REE are a series of metallic elements ranging from lanthanum (atomic number 57) to lutetium (71), and of three other elements: yttrium, thorium, and scandium. These elements are not especially rare in Earth's crust, but concentrations of them are rare. REE are constituents of "many various minerals," but especially monazite, bastnaesite, and xenotime.
Analytical Results
To get a quick idea of the variations in distributions of the trace elements we display the concentrations of each element, by sample number, for each of the elements listed below. Certain element concentrations stand out. Silver, for example, spikes relatively prominently in sample 14. Samples B50B and B50C show relatively higher trace-element concentrations compared to nearly all other samples. Analytical results for each sample taken can be found in graphical form by clicking on the element name in Table 2 below.
|
Table 2. - Table of Elements Determined |
|||||||
| Barium | Cadmium | Cerium | Cobalt | Copper | Dysprosium | Erbium | Europium |
| Gadolinium | Gallium | Gold | Holmium | Iron | Lanthanum | Lead | Lithium |
| Lutetium | Neodymium | Nickel | Niobium | Platinum | Praseodymium | Samarium | Scandium |
| Silver | Terbium | Thorium | Thulium | Tin | Titanium | Ytterbium | Zinc |
|
Element names with light backgrounds are REE. |
|||||||
Interpretation of Analytical Results
Is Saharan Dust The Sole Origin of Bimini's Trace Elements? Discover Magazine for March 2005 has an article3 by K. Wright that describes the huge dust clouds that come off Africa toward the southeastern United States. This process has been going on for at least a few thousand years. Wright notes that Darwin remarked in 1846, while reflecting on his passage to South America, as follows: “…nearer to the African coast the quantity of dust in the air is still more considerable. Vessels have several times run on shore owing to the haziness of the air.”
More recently, J. Prospero and T. Carlson4 estimated from measurements made in 1969 that 25 to 35 million tons of dust are transported through the longitude of Barbados each year. They also state that “this quantity of dust is sufficient to supply all of the material of pelagic sedimentation across the entire northern equatorial Atlantic Ocean.”5
S. Herwitz, et al. tried to determine the parent dust source of clay-rich soils (called paleosols) of Quaternary age found on Bermuda.6 These paleosols are interbedded with carbonate formations. Fine-grained fractions of the soils were analyzed by energy-dispersive X-ray fluorescence to determine trace element concentrations of Zr, Y, La, Ti, and Nb.
When compared with geochemical signatures determined for three possible sources of airborne dust (Great Plains loess, Mississippi River Valley loess, and Saharan dust), Herwitz, et al. found that Zr/Y and Zr/La ratios found in Bermuda paleosols have a predominantly Saharan aerosolic dust signature.
Herwitz et al.'s values were 2.63 ± 0.50 for Zr/La and 4.26 ± 0.80 for Zr/Y, for Saharan dust. We wanted to compare such ratios, as determined from the Bimini samples, to these ratios of Herwitz, et al. for Saharan dust. However, because our method of analysis of Bimini soils, represented by samples B1-B7, did not determine either Zr or Y concentrations, we substituted Nb for Zr to make a comparison.
Our Nb/La value for the Bimini soil samples came out to 0.08, compared to the other authors' value of 2.63 (for Zr/La) for their Bermuda samples. Although the comparison lacks a measure of true compatiblity, it seems quite possible that our ratio values may not be as representative of Saharan dust as Herwitz, et al.'s values for Bermuda were concluded to be.
To be completely up-to-date on this matter, we sent the raw data for our Bimini samples to one of the leading researchers on REE signatures found in Saharan dust. This individual plotted our element concentrations, as normalized to chondrite meteorite concentrations, and then wrote to us as follows:
As you can see on the first plot, your concentrations … show an upper crustal type pattern, with relatively high, light REE, a negative Eu anomaly and a relatively “flat” heavy REE. This is the sort of pattern we see in the Saharan dust as well, but most all upper crustal rocks, sediments, and soils will give a pattern more or less like this.
There are some differences, however, too. Your samples show slight, positive Tb anomalies, which our Saharan dust samples do not have. Also, your samples are trending toward a slight, negative Ce anomaly, which our Saharan dust does not. Your samples fall pretty close to the field for Saharan dust for Eu/Eu* vs. GdN/YbN, but they are lower in the light REE, making them fall outside the range for LaN/YbN.
{Note that Eu*7 stands for a calculated value for Eu to align it with that expected from the chondrite standard value that is used to normalize REE in a trace element suite for comparative purposes with other REE suites. Subscript N refers to a chondrite-normalized value, as explained later on when we go into the subject of normalization of REE suites to chondrite or shale standards.}
Our conclusion at this point is that the Bimini REE suite appears to reflect to some degree a Saharan dust signature. But the differences indicated by the researcher above indicate that there is room for other interpretations than one that would simply dismiss the Bimini REE signatures as being due solely to Saharan dust particles falling on Bimini.
Considering a Buried Volcanic Rock Source to Explain the
Trace-Element Signatures of the Bimini Samples
Background. At this point, we approach our evaluation of the trace-element signatures on Bimini from the viewpoint of a geologist prospecting for buried mineralized zones.
MMI surveys have been used successfully to find buried mineralized zones in carbonate environments. And they have been used successfully to find precious metals concentrations buried beneath lake sediments, by taking samples of lake-bottom materials. Thus, there was little new in our approach to doing geochemical prospecting.
In the case of Bimini, we know that chances are very high that a volcanoclastic basement lies directly beneath the islands (cf. R. Sheridan et al., 1988, Fig. 16)8. And, as shown in Figure 7 from Sheridan et al., the Bimini Islands lie just south of the interpreted trend of the Bahamas Fracture Zone (BFZ) in these basement rocks.
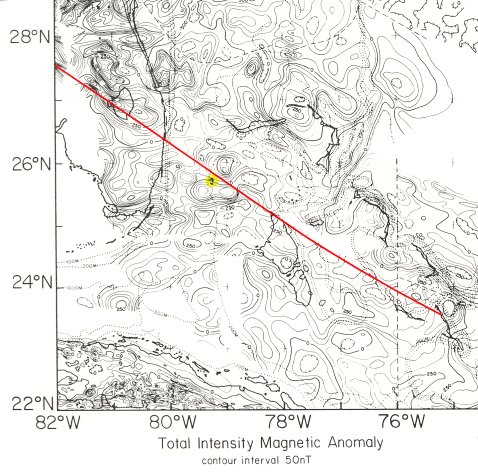 Fig. 7 - The interpreted trend of the Bahamas Fracture Zone, (red) superimposed on a portion of the total-intensity magnetic-anomaly map of the Bahamas region. Yellow spot designates Bimini Islands. Modified from R. Sheridan et al. (1988).
 Also, the wildcat well drilled at Great Isaac Light (see top of Fig. 4) at the north end of the Great Bahama Bank could have missed any tall volcano lying directly below Bimini, or any intrusion that might have moved up fractures in the 17,500+ feet of carbonate rock between the surface and the basement platform of volcanics. That is, we could be dealing with an intrusive dike9 that cuts across the limestone bedding, rather than igneous rock occurring at the top of a buried volcano.
As a result of these speculations, Hutton made a further conjecture. He suggested that there might be an unusual type of volcanic rock beneath Bimini, to account for the many varied minerals predicted in 996-12 to exist there at a shallow depth of 12-15 ft. And only a thin layer of carbonate rock in the vicinity of the Bimini inlet might cover the conjectured volcanic rock.
Hutton's speculation hinged further on the presence of a crystal-rich porphyritic “normal” variety of natrocarbonatite (Na-carbonatite) volcano there. Such a volcano would contain a type of lava low in iron (Fe2O3), to comport with the weak magnetic susceptibility of Figure 7, so uncharacteristic of most volcanic rocks.
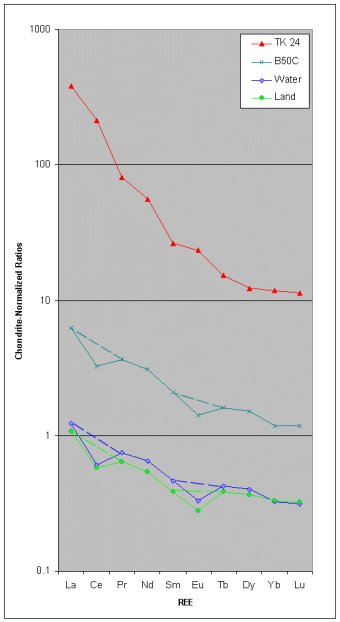 Fig 8 - Chondrite-normalized REE patterns for Bimini sample B50C; for land samples B1-B8 and B22-B24; for water samples B9-B21 and B25 and B30, and for the virgin calciocarbonatite volcanic rock TK-24. Dashed lines represent estimates of traces after restoring Ce and Eu depleted values by free-hand drawing.
 An example of a carbonatite volcano, of the type hypothesized to lie beneath Bimini, is the Oldoinyo Lengai volcano in Tanzania. See Hutton and Eagle (pp. 284-288) for more extensive treatment of this type of volcano and lava, and the fact that both could be linked to the “many various minerals” mentioned in the Cayce reading above.
Comparing African Carbonatite Volcano Data to Bimini Carbonate Soil-and-Sediment Data. We compared the trace element compositions that were determined for all 30 Bimini samples to those found for Oldoinyo Lengai lava, for an average of several sövite samples, and for two extra-Ca Ca-carbonatites. Data for these natrocarbonatite and calciocarbonatite samples are found in Table 3 of Keller and Spettel's chapter10 in the IAVCEI book for the Proceedings in Volcanology (4), a conference on Oldoinyo Lengai held in 1990.
To make our comparison we constructed ratios for ten of the REE found at Bimini using data for the identical REE in the chondrite standard. We then plotted these chondrite-normalized ratios on a graph to assess the pattern similarities between the composite Bimini data and each of the seven data sets presented by Keller and Spettel for Oldoinyo Lengai trace-element signatures. The closest pattern comparison was between the Bimini data set and that for the calciocarbonatite TK-24 sample from Kerimasi, a carbonatite volcano located close to Oldoinyo Lengai.
Note that the three curves for the normalized Bimini values have dips at Ce and Eu. The negative cerium anomaly likely reflects the seawater environment of this MMI, while “a europium anomaly is typical of many continental rocks as well as most sediments and seawater.”11 Thus, Ce and Eu were elevated artificially to their ‘normal' concentrations in the chondrite normalized plot of ratio values of Figure 8, to illustrate what their non-seawater curves might look like.
Fig. 9 repeats the ratio patterns for REE of TK 24 and B50C, as chondrite normalized and shown earlier on Figure 8. Shown also on Figure 9 is the REE pattern for B50C, but normalized using the average shale standard. The shale standard is used by geochemists to explore the differences in REE patterns between sediment types. We use it here as a way to differentiate between a possible volcanic (igneous) rock source for the Bimini REE suite and one for a) a coal (leading to fly-ash) source, or b) a sedimentary rock source, or c) a continental-rock Saharan-dust source.
Because the two B50C patterns are so different for the shale- and chondrite-normalized plots, we conclude that neither coal fly-ash nor Saharan dust are contributing significantly to the Bimini REE suites.
As a further check on the true difference between the chondrite-normalized ratio pattern for sample B50C and like ratio patterns for samples of oolitic sand obtained from a presumably virgin area of the Bahamas Plateau, we decided to use S. Tlig's data from his 1987 article on REE distributions in various carbonate rocks.12
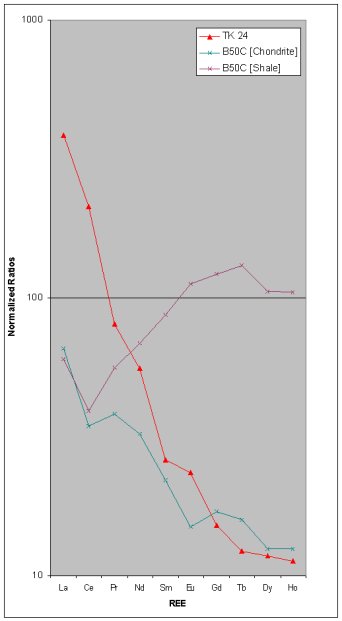 Fig. 9 - Chondrite- and shale-normalized REE patterns for sample B50C, and the chondrite-normalized plot for the Kerimasi calciocarbonitite lava sample TK 24.
 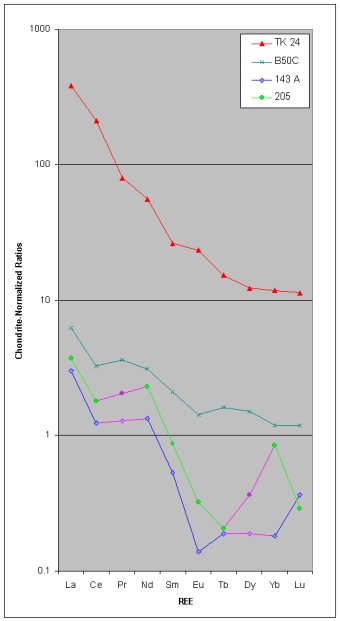 Fig. 10 - Chondrite-normalized ratio patterns for two “virgin” Bahamian oolite samples (143 A and 205), Bimini sample B50C, and Kerimasi calciocarbonatite lava sample TK 24. Magenta segments indicates interpolated values.
Figure 10 is a plot of chondrite normalized data for Tlig's sample 143 A, “a pure oolitic sand,” and for his sample 205, “a slightly hardened oolitic sand from the Bahamas Plateau” (Tlig, p. 105). One can see that the patterns for these two samples differ rather markedly from those of the patterns for B50C and TK 24. One can see also that the B50C suite of REE is quite similar in pattern to a depleted, sea-water modified REE suite obtained from the virgin lava suite of the Kerimasi calciocarbonatite lava sample.
Our interpretation, then, is that B50C is so different from the REE patterns for virgin oolite samples 143 A and 205, that B50C may very well indicate that buried calciocarbonatite-type volcanic rock lies only a short distance below the bottom of the Bimini Inlet channel at this location.
What Rocks and Minerals Might Lie Beneath the Bimini Inlet Area?
It would seem from the above work that a carbonatite volcano or intrusive dike might lie just below the bottom in the vicinity of the Bimini Inlet, as Hutton speculated might be the case in his article, "A Volcano Link To Bimini's Gold And Spar?", and in our book on pages 285-290. A variety of exotic minerals, such as pyrochlore, perovskite, bastnaesite, etc., frequently occur in carbonatites. Carbonatites are widely distributed on Earth, with over 500 occurrences having been identified. Although of minor areal extent, their unusual origin and exotic mineralogy often give rise to rare-earth, niobium, and copper ore deposits.
Most carbonatite is intimately associated with olivine-poor nephelinite, or its phaneritic plutonic counterpart, ijolite.
Consider again this question and answer excerpt from reading 996-12 at the beginning.
(Q) What minerals will be found here?
(A) Gold, spar, and icthyolite [?]. [Ichthyolite?]
Ijolite, as in “ijoite minerals,” seems the best substitute for the word icthyolite in this exchange. The stenographer who took down Cayce's reading was clearly confused about the word she had heard, thus the question marks for the two different spellings.
Ijolite rocks are characterized by a long list of accessory minerals such as apatite, sphene, calcite, melanite, phlogopite, sodalite, perovskite, wallastonite, cancrinite, pectolite, and zeolites. Any of these minerals may increase sufficiently in amount to become a major constituent of ijolite. Some of these minerals are moderately valuable "spar" minerals. They are translucent or transparent, readily cleavable, and lustrous.
As for gold in the Q/A just above, Au was not detected above the instrumental detection limit of 0.7 ppb. Silver, however, was detected in all samples, spiking to 945 ppb in B14, and to 95 ppb in sample B22. Gold and silver are very often found together in MMI surveys, and so the absence of gold must mean that it either does not exist in the area, or that it exists in a vein farther NE or SW along the presumed mineralized zone.
Another possible reason for the difference between the reading's statement about finding gold in a vein at Bimini and our lack of finding any MMI gold may be due to a certain wavering, or “shading” of the truth as was channeled by Cayce in the 996-12 reading. Here's the explanation of wavered information from an early Cayce reading.
(Q) Explain: "By the suggestion the subconscious may be wavered by the forces that are brought to bear on the subconscious to reach conscious mind, just as we have in a purely mechanical form." [3744-3, Par. 18-A]
(A) In the wavering of forces as applied from the subconscious to the conscious mind, first we must take into consideration that conscious mind is of the material world a part. The subconscious mind may only be fully understood when viewed from the spiritual viewpoint or aspect. The conscious mind rarely gains the entrance to truth in the subconscious, save in rest, sleep, or when such consciousnesses are subjugated through the act of the individual, as in the case of Edgar Cayce, through which the subject matter was given. The illustration as given of mechanical way, that is as appearance of stick in water appears bent. When the consciousness views subconscious forces they appear wavered or bended, when viewed from wholly a material viewpoint, whether from the dream in sleep, or viewed by a conscious mind or material mind of truth from trance or from the subconscious condition. Hence in the sleep we may have the superseding appearance of the consciousness and thus waver the appearance of truth obtained, or we may have the suggestion as is given to a mind directing the truth to be obtained from subconscious forces bended in such a manner as to give the wavered aspect to the truth as given. In such a manner, or in one of such manners, then do we see the wavering often (not always) of truths obtained by a consciousness from the subconscious forces. Just as illustrated in the mechanical manner as given in subject matter.
(900-59; April 13, 1925)
Thus, “the appearance of truth obtained {a precious metal in this case}… may have been bended in such a manner as to give the wavered aspect {from gold to silver, for example?} to the truth as given.” We have discussed extensively the subject of wavered truth, and how it could have come about from the various sources contacted by channeler Cayce, as well as many factors that could have affected Cayce's transmission of truth while giving a reading, in our web article entitled, "The Sources And Veracity Of Edgar Cayce's Readings - Part 1." Our analysis of wavered truth was first published on our web site in September 23, 2002, and later in chapter 45 of our book on “Sources and Reliability Factors” of the Cayce readings.13 We note in particular the following important information on the subject of how the truth could have been wavered or shaded during a Cayce reading.
When there is a question in the mind of the seeker, when there is a question in the interrogator {conductor of the reading}, when there is a question in the recorder's mind, THESE must influence that interpretation of that seen by the channel {here, Edgar Cayce} through which the information comes.
(534-2; April 20, 1934)
At the time that reading 996-12 was given, Cayce's wife was the conductor and Gladys Davis was the recorder. It seems unlikely that either of these would have been thinking that gold would be mentioned in the question presented to Cayce, "What minerals will be found here?" The two treasure seekers turned resort developers that were present for the reading, however, could well have been thinking that gold would be in Cayce's answer, "Gold, spar, and icthyolite [?]." These were Mr. A. C. Preston and his business friend, Mr. Thomas Peters. These men had been interested in finding treasure at Bimini from the start. And gold in those days was considered far more valuable that silver. Thus, gold was probably high on the mental agenda of Preston and Peters, and could well have been subconsciously projected into the environment of the reading room. If so, the true precious metal (silver) might have been apprehended by Cayce's conscious mind as "gold," perhaps due in large part to thoughts of gold being projected as one of the "MANY sources of revenue ... {from} these mountain tops ... {that} will produce many various minerals," spoken of earlier in the reading (see above).
Additional Work Needed To Aid In Interpret Of Bimini's Subsurface
The original 14C dates plotted on Figure 1 of Boardman, et al.'s 1988 article, “Holocene sea level in the Bahamas,” 14 should be corrected to calendar years and re-plotted on Fig. 1 of the present article. This will permit any “Bimini-related” corrections to be made to the Toscano and Macintyre curve of our article, and to develop an approximate relative sea-level rise (RSLR) curve for Bimini. Such a RSLR curve will provide an estimate of possible vertical crustal movement at Bimini over the last 10,000 years or so.
Insights from the Bimini RSLR curve may also come by relating the curve to S. Boss's 1994 actualistic model of early sequence evolution on the Great Bahama Bank.15 Of further significant importance is the dating – if only by relating sediment cores to the Bimini RSLR curve – to the period of dune building and/or lagoon filling at Bimini. Boardman, et al. (1988, p. 50), for example, think that “14C dating of bioclastic sand from numerous coastal dunes of San Salvador…clearly suggests that a major episode of dune building occurred between 6,000 and 4,000 years ago.”
An explanation of the formation history of the Bimini inlet could be useful for speculations as to how late (earlier than 7,500 B.P.?) the supposed vein (Fig. 1) was still open to human beings. If the inlet marks a now-buried mining operation of supposed Atlanteans, later men could have accessed the "many various minerals" there. One presumes that such minerals would have had wide distribution.
SUMMARY
Geochemical Survey
An MMI survey of soils and underwater rocks and sediments yielded results supportive of our inference of a calciocarbonatite lava intrusion in the inlet area. We are encouraged that concentrations of 25 out of 32 of the elements found increase with increasing sample depth below mean sea level. This is to be expected as one takes samples closer and closer to a buried mineral source.
It was also encouraging to find relatively high concentrations of silver in samples B14 and B22. The lack of any gold above detection limits in all samples, however, does not comport with the prediction of reading 996-12. If gold is present it might lie along the trend of the mineralized zone but farther to the northeast, or southwest, of the sampling area.
Listed below are additional findings that support the inference that a mineralized zone of calciocarbonatite volcanic rock of low iron-content lies buried beneath the inlet carbonate rocks and sediments, and quite possibly beneath the sand dunes just south of the taxi dock as well.
Oil-well core composition. Core compositional data for a wildcat well drilled at the northwest end of the Great Bahama Bank, about 23 statute miles north-northeast of Bimini, suggests that in all probability the basement beneath Bimini is either lava or volcanoclastic material. An unknown amount of carbonate rock lies between the land surface at Bimini and this volcanic basement.
Geomorphic expression of the NW Great Bahama Bank (GBB). The protrusion of the GBB into the Gulf Stream along Bimini (Fig. 2) may reflect a large volcanic cone at depth. As the GBB slowly sank, the volcano would have caused the Gulf Stream to flow around it, building out the carbonate bank along the western side of the volcano.
We asked an oceanographer of vast experience in mapping fractures and seamounts in several oceans to comment on our idea of a volcano being associated with the Bahamas fracture zone, which is interpreted to trend WNW-ESE on the sea-floor just north of Bimini. He responded as follows:
“Many fractures are hidden in the ocean basins. All have a certain degree of overprinting by volcano growth. Additionally, much of the Atlantic Ocean basin is underlain by continental crust….and so, yes, seamounts may be buried beneath overlying sediments. This would be particularly true in the region of your study.”
Geomagnetic survey. Our magnetic map of the inlet area (Fig. 5) indicates that a possible mineralized zone (red, orange, and especially the yellow pattern) of relatively low iron content extends in the NE-SW direction, from the eastern side of the inlet northeast into the Bimini lagoon.
Work Remaining to Validate Reading 996-12 About the Mineral Vein
As a reminder, the following link between Bimini and {hypothetical} Atlantis was mentioned specifically in the following passage from reading 996-1:
Yes, we have the land known as Bimini, in the Atlantic Ocean. In the formation of the land, we find this of the nature that would make the oil production very low, for this is of the coral structure in the greater part, but this is the highest portion left above the waves of once a great continent, upon which the civilization as now exists in the world's history {America, as reincarnated Atlantis} found much of that {minerals suitable to a high-tech civilization} as would be used as means for attaining that civilization.
996-1; August 14, 1926
A drilling and sampling program should be mounted to probe the sub-bottom strata in the vicinity of the Bimini Inlet. Only then will it be possible to either move forward in a wider exploration activity, or to set aside all further consideration of a link to Atlantis at Bimini.
Our expectation is that any carbonate cap-rock lying over the mineralized zone at the “twelve to fifteen-foot levels” below the inlet floor would be slightly younger than 7,500 B.P. Thus, if one were to drill to try to take a sample of the mineralized vein at the “twelve to fifteen-foot levels” he would best be prepared to drill to at least 30 feet below mean sea level to be sure to reach the vein.
Human curiosity is such that someone, or some group, will one day mount a drilling rig on a barge, anchor it over the proper location, and recover the first ancient rock evidence of the last chapter of the legendary Atlantean civilization.
Or the group will recover instead an unremarkable core of soft limestone … and the search for “that record in the rocks” that shows a Bimini-Atlantis connection will have failed. Only then will the matter of the wavering of truth transmitted via Cayce's mind be revisited, to the enlightenment of all who are interested in knowing about such phenomena.
Acknowledgments
We wish to acknowledge that the financial support for most of this study was provided by one of our friends, who desires to remain anonymous for the time being. We would also like to thank the ARE, and Mr. Don Dickinson for funding Mr. Eagle's acquisition and analysis of the high-resolution IKONOS satellite data set of the Bimini Islands.
- Cameron, E., et al., 2004, Finding deeply buried deposits using geochemistry, Geochemistry: Exploration, Environment, Analysis, v. 4, pp. 7-32.
- Mann, A. et al., 1998,Application of the mobile metal ion technique to routine geochemical exploration, Jour. Geochemical Explor., v. 61, pp. 81-102.
- Wright, K., 2005, “Blown away,” Discover Magazine, March, pp. 32-37.
- Prospero, J., and T. Carlson, 1972, Vertical and areal distribution of Saharan dust over the Western Equatorial North Atlantic Ocean, Jour. Geophys. Res., v. 77, no. 27, pp. 5255-5265.
- A fitting blanket for Poseidia's 12,000-year sleep-over, prior to its predicted wake-up call in the Aquarian age. (Reading 2012-1 states: “…the Atlantean land that sank….will rise, and is rising again.”)
- Herwitz, S., et al., 1996, Origin of Bermuda's clay-rich Quaternary paleosols and their paleoclimatic significance. Jour. Geophys. Res., v. 101, D18, pp. 23,389-23,400.
- The Eu/Eu* parameter is a measure of the degree of the Eu anomaly. "Eu" as used in this ratio is the chondrite-normalized Eu concentration in the sample. "Eu*" is what the Eu concentration would be if there were NO Eu anomaly, i.e., if the REE curve (chondrite-normalized) showed a smooth decrease as you went from the light REEs to heavy REEs. It is calculated, however, as (SmN x GdN)0.5 {chondrite-normalized Sm concentration times chondrite-normalized Gd concentration; then take this product to the one-half power}. Values less than 1.0 for Eu/Eu* indicate negative Eu anomalies, typical of the upper crust. Values greater than one indicate positive Eu anomalies, which is what is found in the lower crust OR in plagioclase-dominated rocks or sediments (e.g., an anorthosite for example). Values near to 1.0 (i.e., NO Eu anomaly) are going to be typical of mantle compositions; e.g., relatively pure oceanic basalts, or similar rocks.
- R. Sheridan et al., 1988, Geology and Geophysics of the Bahamas, in R. Sheridan and J. Grow, eds., The Geology of North America, Volume 1-2, The Atlantic Continental Margin, Boulder, CO: Geological Society of America, 360 pp.
- If one drives north out of Sedona, Arizona up Oak Creek Canyon he can see a roughly 3-ft-wide feeder dike of ancient lava in the cliff to the east. That dike conveyed material at least 7,000 ft from the igneous rock below to the lava cap of the plateau above. Such a dike could have done the same at Bimini, but prior to the global sea-level rise that covered the Great Bahama Bank at Bimini some 7,000-9,000 years ago, thus facilitating deposition of a limestone cap on the old Pleistocene land surface.
- Keller, J., and B. Spettel, 1995, The trace element composition and petrogenesis of natrocarbonatites, in Carbonatite Volcanism: Oldoinyo Lengai and the petrogenesis of natrocarbonatites, K. Bell and J. Keller (Eds.), Springer-Verlag, pp. 70-86.
- White, W., 2001, Geochemistry, chapter 7, “Trace elements,” web published at http://www.geo.cornell.edu/geology/classes/Chapters/
- Tlig, S., 1987, The Sr rare earth element (REE) behavior during diagenesis of limestones in various environmental conditions, in, “The practical applications of trace elements and isotopes to environmental biogeochemistry and mineral resources evaluation,” R. Hurst and S. Augustithis, eds., Theophrastus Publications, S. A., Athens, Greece, pp. 103-140.
- Hutton, W., and J. Eagle, 2004, Earth's Catastrophic Past and Future – A scientific analysis of information channeled by Edgar Cayce, Universal Publishers, Boca Raton, FL, 483 pp. (See chapter 45).
- Boardman, M. R., Neumann, A. C., and Rasmussen, K. A., 1989, Holocene sea-level in the Bahamas. In Mylroie, J. E. (Ed.). Proceedings of the fourth Symposium on the Geology of the Bahamas: Bahamian Field Station, San Salvador, Bahamas, June 17-22, 1988, 45-52.
- Boss, S. K., 1994, Early sequence evolution on carbonate platforms: An actualistic model from northern Great Bahama Bank, Ph. D. dissertation, Univ. North Carolina