
Archived Articles
Tales From The December 2002 Meeting
Of The American Geophysical Union
Of The American Geophysical Union
Introduction
American Geophysical Union (AGU) scientists from all over the world met again this past fall in San Francisco to swap tales about their research in various fields of the geophysical sciences. I get the abstract volume every year and look for gems of new data, findings, and theories that bear upon the potential validity of Cayce's Earth-changes and pole-shift readings.1
Here are some of the more relevant findings for your perusal.
Studies Bearing on Earth's Changing Shape Since 1998
(A possible precursor of the pole shift of the Cayce readings)
A hot topic at the AGU meeting was one we discussed earlier in a THC article entitled, “Possible Pole-Shift Precursor Found!”
Simple-English version of the research studies reported. Three studies have now confirmed the validity of earlier satellite-based measurements of a change in Earth's pumpkin shape (“oblateness”) that began to be observed in 1998. These measurements reveal shifts in quantities of our planet's matter from northern and southern regions toward the equatorial region. Different interpretations of the nature of the matter shifted range from atmospheric volumes, to quantities of ocean waters, to the flow of dense volumes of molten iron in the Earth's outer core. NASA scientists have proposed that masses of ocean waters have moved toward the equator, causing a change in Earth's oblateness. Harvard University scientists concur with this notion but think that a respectable percentage of the measured mass movement is due to currents of fluid iron in the core. We come down on the side of the Harvard geophysicists.
New, more precise satellite measurements are now underway. It is extremely important for humanity to monitor these global mass movements, as any strengthening of them will, in all probability, lead to the great change to be experienced by the Earth in the shifting of the poles (reading 826-8). This change was to begin in 2000 to 2001 A.D., but this time frame may be off by a year or more, as the truth of the dates given may well have been “wavered” or “shaded,” to use the language of the readings.
Scientific-speak version of the research studies reported. The possible precursor to pole shift that THC has been proposing is a sudden change in Earth's dynamic oblateness (designated “J2”) as measured by a space geodetic technique for over more than two decades. Since 1998, Earth's J2 has begun to increase, indicating a pronounced global-scale mass redistribution within the planet from high to low latitudes. It is this mass redistribution that can, should it increase sufficiently, lead to pole shift.
Cox and Chao reported this discovery of a change in J2 in Science (August 2, 2002) but left the sources of the anomaly unresolved. Dr. Jane Dickey, of NASA's Jet Propulsion Laboratory, and three colleagues presented a NASA study (abstract U72A-0013) that indicated that this change in oblateness is due to large-scale movements of ocean waters. BBC Science picked up the story, promoting it in a web-based article entited, "Earth's equatorial 'obesity'."
Earth's equatorial 'obesity'
By Molly Bentley
BBC News Online, in San Francisco
Fluctuations associated with climate warming are behind the Earth's mysteriously expanding waistline, scientists said at the American Geophysical Union (AGU) fall meeting in San Francisco this week.
A surge in sub-polar glacier melting, along with shifts in ocean circulation, had forced massive redistributions of water away from the poles to the Earth's midsection, said physicist Jean Dickey of the Jet Propulsion Laboratory (JPL) in Pasadena.
The result is a planet shaped increasingly like a pumpkin.
"Some people refer to it as equatorial obesity," said Dr Dickey, co-author of a study recently published in the journal Science.
Researchers from JPL and the Royal Observatory in Belgium sought to explain the increasing oblateness of the Earth after scientists first reported on it in this summer.
Earth 'getting fatter'
In that study, gravity measurements revealed an abrupt reversal of post-glacial rebound, which for millennia had produced a rounder Earth.
Planet's health
The reversal stunned scientists, but they puzzled over its cause.
The new study links a tripling in the average glacial melt rate - from 100 cubic kilometres in 1989 to 320 cubic kilometres in 1998 - to the squishing of the planet and the subsequent changes in the gravity field.
"The gravity measurements suggest there is a big change in the Earth, both in its oceans and its ice," said Dr Dickey. "One has to be concerned for the health of the planet."
For that reason, scientists are anxious for more sophisticated climate monitoring. The AGU conference highlighted two important new space missions that will do just that.
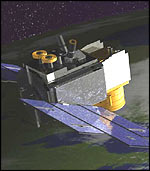
The Gravity Recovery and Climate Experiment (Grace) is already underway.
The US space agency (Nasa) and German Aerospace Center mission aims to create the most accurate gravitational maps to date by measuring minute shifts in mass over the Earth's surface.
Bouncing beams
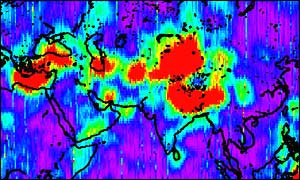
AGU participants saw the first image from Grace - a map (see pop-up for full image) of colour gradations that reveals gravitational hot spots around the planet. Areas of strongest gravitational pull - such as the Himalayas or the Pacific Ocean - appear in red.
The map shows accuracy that is unprecedented in gravitational monitoring, according to Byron Tapley, the project's principal investigator at the Center for Space Research at the University of Texas at Austin.
"With roughly three months of Grace data," he said, "we've done an order of magnitude better than we've been able to do with some 30 years of satellite data."
That includes satellite laser ranging - the technique that detected the Earth's growing bulge - which relies on bouncing laser beams between numerous satellites and ground stations, and is accurate to within two to three millimetres.
By contrast, Grace relies on microwaves, shooting them back and forth between twin satellites which orbit the poles nose-to-tail, 220 kilometres apart.
Water movement
As the first satellite lurches and drags through the Earth's uneven gravity field, the second follows in a calibrated pursuit, measuring the intervening distance to the micron (a thousandth of a millimetre).
Since the predominant movement in the Earth's mass comes from water, Grace mainly tracks weight redistribution associated with shifts such as ocean circulation, glacial melt or the depletion of an aquifer.
"It gives us another remote sensing tool to understand the Earth's climate and how water is moving around the Earth," said Michael Watkins, Grace project scientist at JPL.
"If water were to melt from the poles and go into the ocean, we could detect that change."
Another unique remote sensing tool will soon join Grace in space as scientists anticipate the launch of the Ice, Cloud and Land Elevation Satellite (ICESat).
While Grace measures water mass, ICESat will measure ice sheet elevation. It is scheduled to launch from Vandenberg Air Force Base on 19 December.
Exciting times
"The geophysical community has been waiting for ICESat for 30 years," said Nasa researcher Eric Rignot, who studies the Antarctic ice sheet.
The satellite's unique cargo - the Geoscience Laser Altimeter System (Glas) - is the first space laser altimeter used to detect ice sheet mass balance.
While changes in ice sheets strongly influence sea level and are therefore critical in assessing climate change, glaciologists do not have the precise data they need to determine whether the massive ice sheets in Greenland and Antarctica are currently growing or shrinking or how they might change as the Earth warms, according to ICESat project scientist Jay Zwally.
"We actually have better information of planet Mars than we do Earth," said Dr Zwally, referring to a laser altimeter that Nasa flew around the Red Planet a few years back.
Along with ice sheet measurements, ICESat will provide data on sea ice, vegetation and aerosol distribution. Combined with Grace, the "dynamic duo", as one researcher called them, have enormous potential for advancing climate science.
"Grace is exciting because it's the first gravity mission," Dr Watkins said, "and ICESat is the first ice sheet altimeter, and in that sense a pioneer. Together they will help us get a much better picture of the climate than we've ever had in the past."
Another group of seven researchers, one of them with NASA/JPL, says (abstract G11-10) “....the ocean appears to be the most likely source of oblateness changes....concentrated in the Pacific ocean.....[and] highly correlated with the Pacific Decadal Oscillation (PDO).” Well, when I was in graduate school in geology we students were taughtto be suspicious of “obvious correlations.” We would be reminded occasionally of a neat study that showed a strong correlation between storks sitting on chimneys in the Netherlands and the numbers of babies born to the women living in the houses below. A good correlation, to be sure, but one devoid of any true physical connection.
Our own take on the possible source of the change in J2 has been that it may reflect mass movements at the core-mantle boundary (CMB). See our shift-precursor article and ignore for a moment the NASA publicity machine that pushes media sources to carry stories (like the BBC one above) about the conclusions of NASA/JPL scientists. We were pleased, then, to see the results of J2 research that two Harvard geophysicists presented in the study titled, “Variations in the Earth's Gravitational Potential Caused by Pressure Changes at the Core-Mantle Boundary” (abstract G11A-10).
M. Dumberry and J. Bloxham only partially agree with the above two NASA/JPL groups of researchers. They propose that at least one additional mechanism participates in the observed changes of J2. This is flow in the Earth's liquid-iron outer core. They note that a geomagnetic jerk was observed at the time of the trend shift, indicating “a possible correlation between the flow in the core and changes in J2.” They mention “a recent study that showed that geomagnetic jerks are explained by simple flow models in the core,” and conclude “that the same flow that explains the magnetic jerks can also explain some of the changes in J2.” This conclusion echoes a similar one by Cox and Chao, the original discoverers of the J2 anomaly, as given below.
“Judging from the large magnitude and relatively rapid evolution of the observed J2 changes, one possible cause could be net material flow driven by the geodynamo in the fluid outer core and along the core-mantle boundary. There is evidence of a substantial geomagnetic jerk in 1999. Such jerks have been associated with flow acceleration in the top of the core, in addition to long-term magnetic dipole changes. Could they be related? To date, no correlation has been demonstrated between the geomagnetic observations and the observed J2. However, a review of geodynamo simulation results indicates that the core models can possibly explain J2 changes depending on the modeling assumptions.”
As we said in our article on the subject of the J2 anomaly being precursor of pole shift,
“Overlooked by Cox and Chao is the seminal work of Woods Hole geophysicist, Carl Bowen on the mass anomaly structure of the Earth. As presented in our review article, ‘Gravity of Inner-Earth Upheavals,' Bowin has postulated that very large mass anomalies lie deep in the Earth, ‘explained, as a first approximation, by topography at the core-mantle boundary.' Furthermore, relief at the CMB consists of masses that are perhaps 100 times greater in magnitude than those of Earth's principal surface features, like island arcs, mid-ocean ridges, and the Azores-high area. [This conclusion of Bowen's would probably be true also for the motion of masses of ocean waters that the NASA authors use to explain J2]. Thus, movements of the deep masses along the CMB can have a profound effect on Earth's spin-axis stability.
More light will be shed on this problem in the near future as data come in from the Gravity Recovery and Climate Experiment (GRACE) satellites that were launched last March to map variations in Earth's gravity field.
More Information on “Upheavals in the Arctic and Antarctic”
Reading 3976-15 states that just before the shifting of the poles,
“there will be the upheavals in the arctic and antarctic that will make for the eruption of volcanoes in the torrid areas.”
Gakkel Ridge volcanic upheavals, 10/1998 - 10/1999. The submerged Gakkel Ridge extends 1100 miles from north of Greenland to Siberia, all of it beneath the arctic ice cap. The ridge is the deepest and most remote portion of the global mid-ocean ridge system, where new ocean crust is continuously created through volcanic activity. I first noticed an extremely rare cluster of 17 light earthquakes (M 4.5-4.9) and 23 moderate quakes (M 5.0-5.5) centered at about 85.7 N and 81.4 E, in late 1998 and through most of 1999. Later, German scientists reported over 200 quakes for this part of the high Arctic. They concluded that this cluster of quakes was due to underwater volcanism. Shipboard investigations followed.
In abstract T52E-02, four geoscientists report on gravity and bottom-typography measurements accomplished from the U.S. Navy's submarine USS Hawksbill. They report finding evidence of erupted magma along the axis of the Gakkel Ridge's ridge-and-valley trend. This eruptive activity has “built up central volcanoes and covered adjacent areas with low-relief lava flows.” They were unable to tell how fresh the lava was.
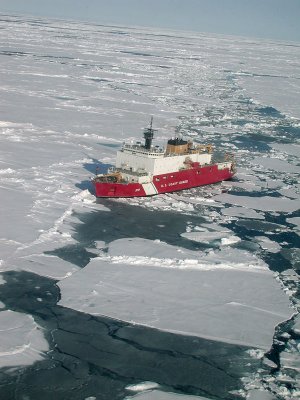 Fig. 1. The U.S. Coast Guard Cutter Healy in arctic ice, while surveying the submerged Gakkel Ridge.
 But an earlier cruise by the US Coast Guard Cutter Healy, an icebreaker equipped for science, and a companion German research vessel, the Polarstern, in late August, 2001 found abundant fresh lava and multiple signs of hydrothermal activity. “A camera and sensor package lowered to the seafloor from the Polarstern showed intact sulfide chimneys and recorded warm water vents. That expedition proposed the name "Aurora" for the vent field.
"We found more hydrothermal activity on this cruise than in 20 years of exploration on the mid-Atlantic Ridge," said Charles Langmuir, co-chief scientist on the Healy from Lamont-Doherty Earth Observatory at Columbia University.
“While the heated water from the hydrothermal vents does not significantly affect ocean temperatures, the vents have attracted the attention of both biologists and geologists. Hydrothermal vents on mid-ocean ridges in the world's oceans provide chemical energy that supports exotic life forms and large ecosystems far removed from the Earth's sunlit surface, where photosynthesis forms the base of the food chain. "Our discovery of these signals clearly shows that hydrothermal vents similar to those present on faster spreading mid-ocean ridges are present in abundance here, too," said researcher Henrietta Edmonds of the University of Texas.”2
Here we have evidence, then, of volcanic and, perhaps, crustal upheavals of the seafloor in the high arctic during 1998 and 1999.
Icelandic crustal upheaval, 2000. We have heretofore been referring to arctic lands and waters as those within or adjacent to the Arctic Circle (66° 33' N parallel of latitude). By “adjacent to” we mean anything north of about the 63° N latitude.3
On June 17, 2000, at 63.98° N, 20.37° W, the South Iceland Seismic Zone experienced the largest earthquake of the last 88 years. This shock triggered earthquakes over a large area of south Iceland, as well as significant slip on three faults on the Reykjanes Peninsula, up to 85 km (53 miles) from the quake's epicenter. (See Fig. 1).
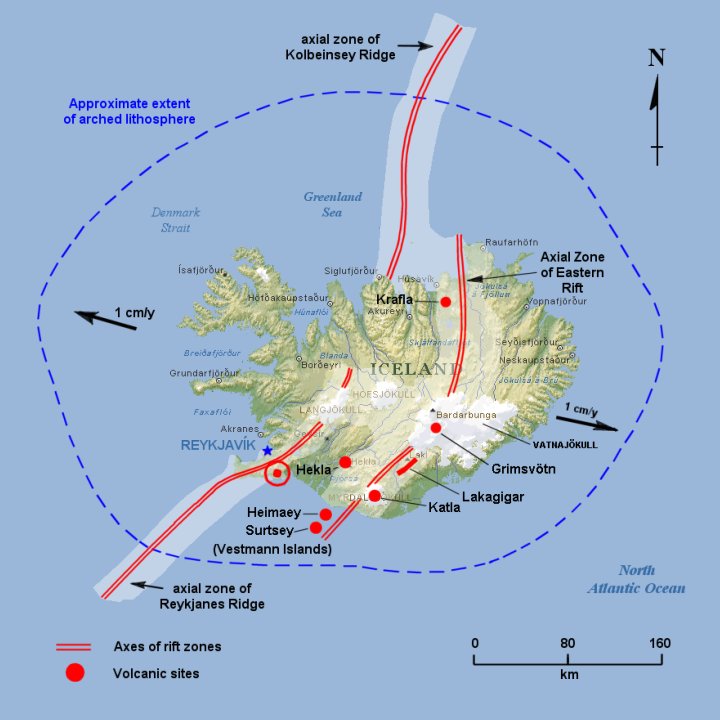 Fig. 2. Rift zones of Iceland. The Reykjanes Peninsula lies between Reykjavik and Hekla. The epicenter of the initial triggering earthquake is shown by the red dot in a red circle.
 In abstract G12C-03, T. Arnadottir and six colleagues describe the crustal deformation on the Reykjanes Peninsula that accompanied the three main earthquakes, as follows.
“An extensive GPS [Geographic Positioning System] network, previously measured in 1993 and 1998, was re-measured in 2000 following the earthquakes and again in 2001. The observations show deformation due to the June 2000 earthquake sequence, motion caused by plate spreading across Reykjanes Peninsula, as well as subsidence at the Svartsengi geothermal area and inflation in the Hengill volcanic area.”
The foregoing describes a fairly notable upheaval in this arctic locale. It reminds us of the November 3, 2002 upheaval (M 7.9 earthquake and crustal changes) near the southern limit of the Alaskan arctic region. We may expect more of such arctic upheavals soon if reading 3976-15, quoted below, is correct.
There will be the upheavals in the Arctic and in the Antarctic that will make for the eruption of volcanoes in the Torrid areas, and there will be shifting then of the poles - so that where there has been those of a frigid or the semi-tropical will become the more tropical, and moss and fern will grow.
“Seafloor Mapping Around the Epicenter of the Great Antarctic Earthquake.” This is the title of AGU abstract T12D-1341.The Japanese authors remind us that the March 25, 1998 quake, located just inside the northern limit of the antarctic region2, was one of the largest oceanic-plate events ever recorded. “The mainshock occurred far from the nearest plate boundary and any [other] recorded earthquake.” Their seafloor mapping effort revealed that the epicenter of the mainshock was centered on a seamount and that the great earthquake probably occurred on a structure that intersected the seamount. The quake's driving force is still unknown, they say.
The Nature and State of the Earth's Core
“After fifty years of progress the interior of the Earth still remains a problem that is at once fascinating and yet baffling!” Thus says G. D. Price in abstract MR71B-03. “Nobody,” Price says, “has figured out how to make a decent estimate of the temperature of the core.”
B. Buffett (abstract MR71B-02) says, “Francis Birch's classic paper of 1952 established the direction of subsequent research in this field and simultaneously provided the first modern view of the Earth's core. On the basis of his interpretation of seismic velocities [speeds of earthquake waves] Birch concluded that ‘the inner core is most simply interpreted as crystalline iron', while the outer core is comprised of ‘liquid iron, perhaps alloyed with a small fraction of outer elements'. Our current understanding of the core is unchanged in broad detail, although there is growing evidence for lighter elements in the crystalline solid [part of the core].”
In an invited presentation (abstract MR71B-01) Harvard Professor, A. Dziewonski, discusses his work, and that of a colleague, on layering or lack of it in the solid inner core. You may recall that it is this layering that can be detected by the bending of earthquake waves as they move from their origin on one side of the Earth, through the solid core, and on to detectors on the other side of the Earth. And it is by following these layers as the core rotates that it was discovered that the core actually rotates faster than the Earth itself, and is tipped on its axis by comparison to the axis of rotation for the entire Earth. This area of research is in ferment and refinements to our understanding are coming out every few months.
The Harvard researchers' work has led Dziewonski and M. Ishii to proclaim discovery of a distinct new region at the center of the Earth. This region is only about 600 km (370 miles) in diameter. They have named it “the inner-most inner core.”
But this may not be the end of this tale of nesting Russian dolls, composed here of successively smaller concentric layers as one progresses toward Earth's center.
Remember the reading that goes:
Q) What will be the type and extent of the upheaval in '36?
A) The wars, the upheavals in the interior of the Earth, and the shifting of same by the differentiation in the axis as respecting the positions from the Polaris center.
5748-6; July 1, 1932
In my book, "Coming Earth Changes" (A.R.E. Press, 1996), I discussed (pp. 28-30) the startling new findings about how Earth's inner core of solid iron might be spinning freely within the molten core, making the inner core virtually a planet within a planet. And I mentioned that the scientists responsible for these findings had determined by earthquake-wave propagation studies that the axis of the core is tilted a few degrees with respect to Earth's north-south axis of rotation. This suggested to me that such a tilt of the core, if it happened in 1936, could engender rising thermal plumes from Earth's outer core of liquid iron and produce profound geophysical effects at Earth's surface over time. Since 1996, this has remained my explanation of the source mechanism for the pole shift and Earth changes predicted in Cayce's readings.
Here's an article that provides a source mechanism of even more fundamental nature. It describes a heat source for inner Earth upheavals that lies at the deepest levels of the planet, in a five-mile-wide ball of uranium at the planet's center. Uranium, far denser than iron, would have gravitated to the very center of the Earth during its formation. And it could have performed as a nuclear reactor -- starting up, running for millions of years, and then shutting down. Repeated cycling would thus be responsible for reversals of Earth's magnetic field.
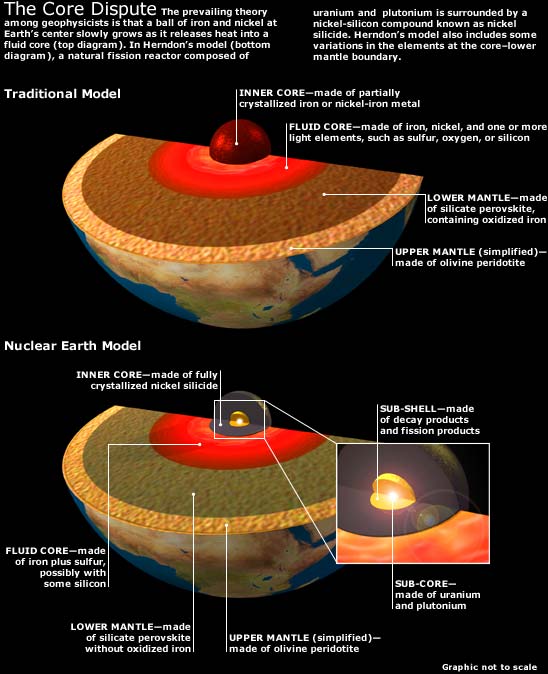 Fig. 3. This figure provides an explanation of the current dispute over the nature of Earth's core.(Graphic by Matt Zang).
 If the scientists that are proposing this uranium-based nuclear reactor at the center of the Earth are proven right, the predicted upheavals in the interior of the Earth would depend significantly upon variations in activity in the uranium-core reactor. The effects of a jump in the activity might involve augmented heating of the iron inner core and the liquid-iron outer core. Mass distribution changes related to this heating would then cause a pole shift, resulting in Earth changes at the surface.
Now consider the following article of June 11, 2002 by Phil Berardelli, UPI's Deputy Science and Technology Editor. (This tale was not presented at the December AGU meeting, but it is so relevant here that it would be a serious “error of omission” to leave it out).
Giant Nuclear Reactor May Run Earth's Magnetic Field
Thousands of miles beneath our feet, a giant nuclear reactor seems to be at work deep within Earth's core, and preliminary research suggests it may be the mysterious power source behind the planet's magnetic field and thermal energy, upon which all life on the planet depends for its survival, scientists told United Press International.
New data analyzed by J. Marvin Herndon, geoscientist and president of Transdyne Corporation, of San Diego, Calif., and Daniel F. Hollenback, a nuclear engineer and criticality expert at Oak Ridge National Laboratory, in Oak Ridge, Tenn., show the reactor -- a ball of uranium about five miles in diameter and located at the center of the core -- may have been operating nearly since the formation of the planet. Herndon told UPI he has been searching for evidence of the deep-Earth reactor for more than a decade. In 1992, he published a series of papers on planet-sized nuclear reactors based on the discovery, 20 years earlier, of the remnants of a large, natural reactor located at the Oklo uranium mine in the Republic of Gabon in western Africa.
French scientists had discovered the Oklo reactor and determined it had operated for tens of thousands of years some two billion years ago, Herndon said, "but at the time of its discovery there were too many pieces missing to know what that really meant." Nuclear reactors operating inside planetary cores might explain some mysteries that have puzzled scientists for years, Herndon said. For example, since the 1960s, astronomers have known Jupiter radiates nearly twice the energy it receives from the Sun. But up to now, they have not been able to explain the phenomenon in a way that makes sense, he said. Earth's magnetic field is an even bigger mystery. Some mechanism obviously generates the field, and many scientists think the field is formed from fluid iron in Earth's main outer core acting like a giant electric dynamo, or motor.
The geomagnetic field, as it is called, shuts down periodically and sometimes reverses its polarity -- with the North and South poles exchanging their magnetic charges. The energy sources previously thought to power the dynamo are unable to decrease and then increase again, Herndon explained, so scientists have had to resort to assuming the dynamo mechanism is inherently unstable. But a nuclear reactor can decrease power output -- and even shut itself down -- and come back to life again, increasing to its full operating power, he said.
Current knowledge of the structure of Earth's interior is derived mainly from seismic data and chemical analyses of common meteorites, Herndon continued. Based on that data, scientists estimate about 30 percent of Earth's mass comprises an outer core, he said, which is thought to consist of iron and maybe one or more lighter elements such as sulfur. The solid inner core is much smaller -- less than 2 percent of Earth's mass.
Still, current popular geophysical models cannot explain, from an energy standpoint, a planet-sized magnetic field that operates like Earth's -- with its varying power levels and periodic shutdowns, Herndon said. Herndon said he received a major insight when he studied a different type of meteorite.
Enstatite chondrite meteorites, as they are called, have chemical compositions similar to Earth's interior. Unlike more common meteorites, enstatite chondrite meteorites contain most of their uranium in the part of the meteorite that corresponds to Earth's core. It was one of the clues Herndon needed, he said. Uranium is the heaviest natural element. It makes sense that, over time, solid uranium particles would rain out from Earth's fluid core at high temperatures.
Because of their high density, they could collect at the very center of the Earth. After enough uranium collected together, a nuclear reaction would begin, and that appears to be what happened very soon after the formation of the planet.
In 1997, Herndon teamed up with Hollenbach at Oak Ridge. The laboratory has unique computer programs that can analyze the performance of different types of nuclear reactors. "Dan showed me those numerical simulation programs could be applied to a nuclear reactor at the center of the Earth," Herndon said. "We used data about the uranium content from the meteorite discoveries to generate simulations at varying power levels." A highly persuasive clue arrived in the form of physical evidence of a nuclear reactor at Earth's core.
Recently analyzed samples of lava rock from deep-source volcanic "hot spots" in Hawaii and Iceland contained tiny amounts of the isotopes helium-3 and helium-4. Although scientists have known about the helium-3 for some time, they have thought it was left over from Earth's formation some four-and-a-half billion years ago.
But no known physical process could produce helium-3 except for nuclear fission, Herndon said, and the proportion of the two helium isotopes matches the prediction of the Oak Ridge simulation. This is strong evidence that the geo-reactor is at work, he said.
Based on the simulations, and the helium evidence, Herndon and Hollenbach theorize a five-mile-wide ball of uranium has been operating as a nuclear reactor for about 4.5 billion years. Its output is an awesome 4 million megawatts. Much of the energy it produces is heat, and that might be what powers the mechanism that produces the geomagnetic field, Herndon said.
Perhaps more interesting, the Oak Ridge programs suggest the reactor is a breeder -- that is, it actually produces more nuclear fuel than it consumes, which is why it has been able to operate over a time frame that spans nearly the entire existence of the planet. In addition, the reactor's power level varies in intensity over time and it shuts down periodically.
A nuclear reactor continuously produces lighter elements, such as strontium or barium, as the uranium fuel fissions -- or splits apart. Those fission fragments would begin to absorb neutrons -- the subatomic particles naturally emitted by the fissioning uranium and responsible for the chain reaction -- thereby preventing them from splitting other atoms.
"One might imagine instances in which the rate of production of fission products exceeds their rate of removal by gravitationally driven diffusion," Herndon wrote in a recent paper on the subject.
If so, he explained, "the power output of the geo-reactor would decrease and the reactor might eventually shut down, thereby diminishing and ultimately shutting down the Earth's magnetic field." Over time, as the lighter elements moved away from the uranium core, the reactor would restart.
This research is "certainly going to be a major contribution to geophysics," Hatten S. Yoder, Jr., director emeritus of the Geophysical Laboratory of the Carnegie Institution of Washington, D.C., told UPI. "They have developed an explanation for (Earth's) magnetic field and the fact that you can turn it on and off." One of the most remarkable aspects of the planetary core reactor, Yoder said, is "it only takes a (five-mile) ball of uranium. That's only 65 percent of all the uranium on Earth." The reactor's existence, if proven, solves the problem of delayed geothermal cooling and explains the observed heat flow, Yoder said. Without a continuing power source, he said, the heat dissipation would have ended long ago. But "if you have a ball of uranium at the center, it would continue to put out heat."
Herndon said he next plans to search lava samples for traces of radioactive elements that might have been produced by the geo-reactor and be light enough to have escaped the core and reach Earth's surface. Lithium, beryllium, boron and neon are possibilities, he said. "It's not an easy task because both rock data and nuclear data are needed, but it certainly is important," Herndon said. Yoder agreed. "High-temperature and high-pressure experiments are needed to test the composition and melting characteristics of the core," he said.
Copyright 2002 by United Press International.
Estimating The Date of The Next Great Tokai Earthquake
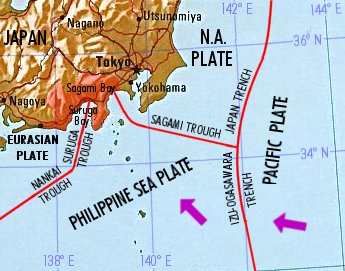 Fig. 4. Suruga Trough and Sagami Trough mark the northward boundaries of the Philippine Sea Plate. Red tinting denotes the area of the Tokai region at greatest risk from the coming great earthquake (M 8.0+).
 On September 1, 1923, at one minute before noon local time, a great earthquake devastated southeastern Japan, including the cities of Tokyo (population of about 3 million) and Yokohama (population about 423 thousand). The earthquake had an estimated magnitude of 8.19. Immediately after the shock numerous fires broke out in Tokyo and Yokohama. The city and harbor of Yokohama were entirely wrecked or burned. A large part of Tokyo shared the same fate. Loss of life was extraordinary, exceeding 140 thousand lives. Property damage was estimated to exceed one billion US dollars at the time.
Tokyo borders on the industrial area of Tokai to the southwest. Earthquakes in Tokai occur every 100-150 years along a plate boundary where it runs through Suruga Bay. The last major quake was in 1854. Seismologists believe that stress that has built up along the Tokai fault line since 1854 could cause a quake up to M 8.0 or more.
The work of T. Seno, at the University of Tokyo's Earthquake Research Institute, provides a date for the next great (M 8.0+) earthquake in Japan's Tokai region. We had mentioned in our article entitled, “Earthquake and Volcano Potpourri,” that the quake had been forecast by others to occur anytime now. See also our earlier article, “Tokyo and Tokai At The Brink:”
Seno's work involves the use of a comprehensive model (see abstract NG62B-0949) that explains variations in seismicity along plate boundaries. In this case the plate boundary of interest is that of the abutting
The date that Seno is forecasting for the next Tokai earthquake is A.D. 2007.6 (-5.4, +2.8), or between March 2002 and May 2010.
Now a model of any geophysical phenomenon is only as good as the data used, the assumptions relative to all processes involved, and the scientist's skills in putting the model together and then manipulating it in the computer so as to keep the model's output results “within bounds.” Various judgments are required in each modeling step. The Tokyo Earthquake Research Institute is one of the best anywhere in the world with respect to developing and operating models for earthquake potential in the Tokai region.
If I were an investor in Japanese companies located in the Tokyo/Tokai region, I would sell those investments as soon as possible.
Studies at Three of the Caldera Volcanoes That We Are Monitoring,
And Which Are Capable of Super-Eruptive Behavior
Long Valley Caldera - Mono Craters Volcanic Field, California. Two USGS researchers, D. Hill and R. Bailey, say that the eruptive pattern of this volcanic field is consistent with a model in which magma from the mantle has been rising through an extending and thinning crust. This activity provides sufficient heat to melt and erode the uppermost mantle to the base of the lower crust. A small eruption at the north end of the Mono Craters as recently as 250 years ago, and persistent unrest within the Long Valley caldera over the past two decades, emphasize that the volcanic field is underlain by an active magmatic system. The authors conclude that, “Aside from these glimmerings, the deep roots of the Long Valley Mono Craters system remain in deep shadow” (abstract S72C-06).
Yellowstone Caldera, Wyoming. Ten researchers from academic institutions worked together to try to determine the source of magma that makes Yellowstone erupt (abstract S72C-04). At the present state of geophysical knowledge for the Yellowstone-Snake River Plain, they were able to construct either a plume or a non-plume model to explain Yellowstone's eruptive behavior. Thus, these geologists are hard at work in a cloud of uncertainty. But the archangel of reading 3976-15 says that the American West will be broken up, presumably when the poles start to shift. Plume or no plume, methinks that Yellowstone will erupt explosively if the western states begin to break up. Crustal stresses and strains will be so great in this sensitive region that an explosive eruption is virtually certain.
Campi Flegri Caldera, Southern Italy. Campi Flegri, also called The Phlegraean Fields, is one of the major calderas in the world undergoing unrest. Several hundred thousands of people live within its borders. This makes for a high volcanic risk from even a minor eruption. Abstract S72C-05 explains that the caldera formed as a consequence of a huge eruption around 40,000 B.P. Over the last ten thousand years, the volcanic activity has been characterized by the occurrence of explosive eruptions thousands of years apart. The last one occurred in 1538. The base of the caldera had been sinking at an average speed of 1 cm per year, from 1538 until 1970. Two resurgency episodes occurred in 1970-1972 and 1982-1984, producing uplift with a maximum of about 3.8 m at the town of Pozzuoli. Then, the ground began to sink again, and is sinking now. This volcanic area is close to Mt. Vesuvius and Naples (Napoli). See Figure 5.
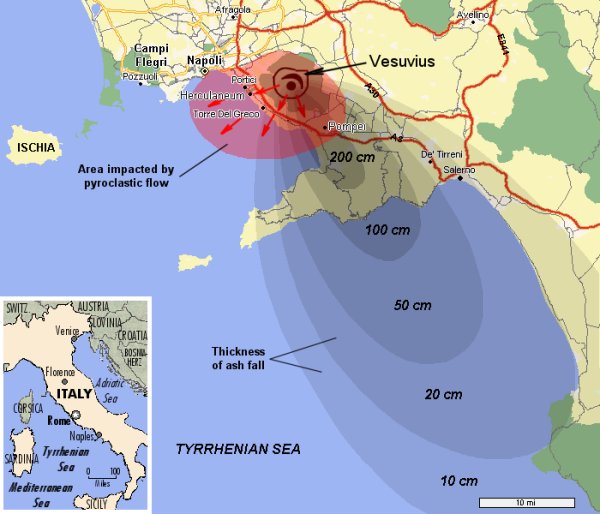 Fig. 5. Location of the restless caldera volcano, Campi Flegri, at Pozzuoli just west of Naples (Napoli). The impacts of the 79 A.D. eruption of Mt. Vesuvius are shown, as modified from Fig. 4-3 of J. Boer and D. Saunders, 2002, “Volcanoes in Human History.”
Do The Tonga Deep Earthquakes of 19 August, 2002 Relate
To The Recent Activity in The Mediterranean (Etna) Area?
Our Bulletin to THC subscribers of November 25, 2002 began as follows:
Near Etna -- A Sunken Isle Is Rising!
Is this the sign that the Earth changes are beginning?
In 1932, Cayce was asked:
Q) How soon will the changes in the Earth's activity begin to be apparent?
A) When there is the first breaking up of some conditions in the South Sea (that's South Pacific, to be sure), and those as apparent in the sinking or rising of that that's almost opposite same, or in the Mediterranean, and the Etna area, then we may know it has begun.
Q) How long before this will begin?
A) The indications are that some of these have already begun, yet others would say that these are only temporary. We would say that they have begun. '36 will see the greater changes apparent, to be sure.
311-8; April 9, 1932
Hidden Island Off Sicily May Reappear
Partial Press Release November 25, 2002
ROME, Italy (Reuters) -- A volcanic island submerged off the coast of Sicily for the last 170 years could reappear in the coming weeks if furious seismic rumblings continue, Italy's chief seismologist said Monday.
"We've seen Etna erupting, seismic activity to the north and east of Sicily and gas activity around the Aeolian Islands," Enzo Boschi, head of Italy's Institute of Geophysics and Volcanology, said.
"The island could come back to the surface, but we'll have to wait and see. It could be a few weeks or months."
Figure 6 below shows graphics and pictures that tell more about the location and nature of Ferdinandea, the island that is reported to be rising:
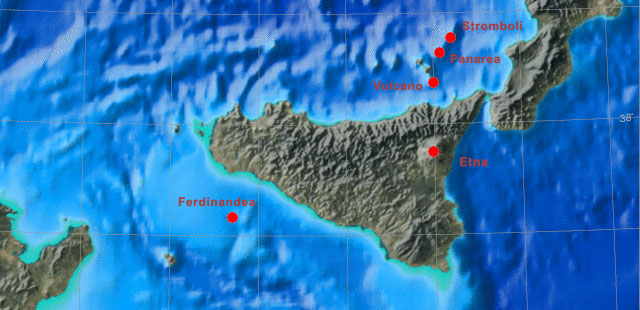
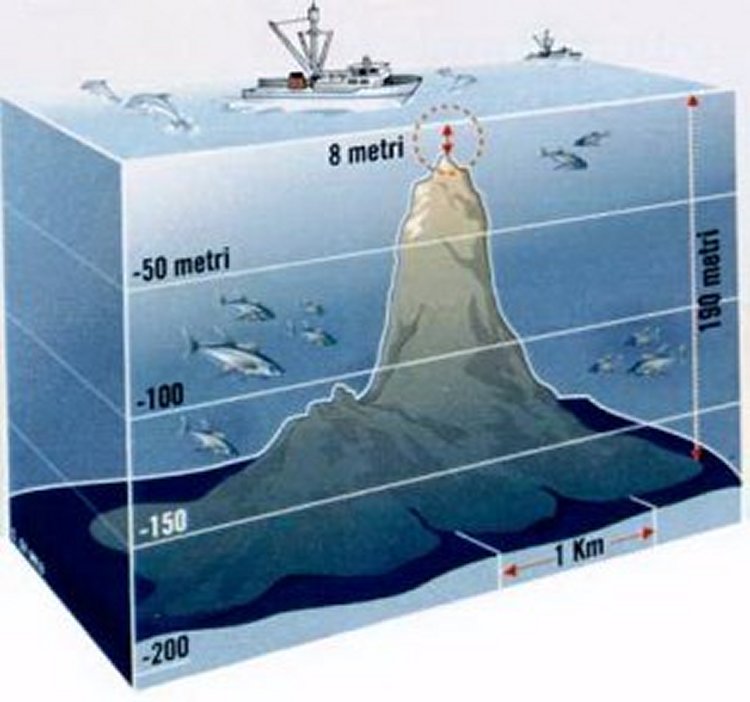 Drawing from L'Espresso n° 18, maggio 2000
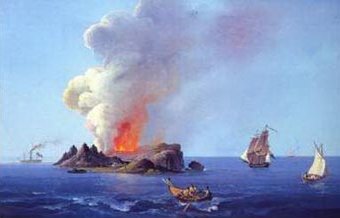 Historical painting of Ferdinandea island.
Fig. 6. Map showing the location of the submerged isle of Ferdinandea, an artist's conception of it, and an historical painting of the island in 1831.
Note that in my analysis of 311-8, in “The Sources and Veracity of Edgar Cayce's Readings, Part 2,” I concluded that, “The Earth-changes information in the reading fragment cited is probably for the most part truthful, and it has predictive capability that may be trusted.” And when I wrote Coming Earth Changes (in 1996)I assumed that the date of '36 (1936) was correct, and tried to explain the apparent absence “of greater changes apparent” in the following way (p. 50):
The reference to " '36 will see the greater changes apparent" can be handled in the same way that the subject of Earth changes in 1936 was dealt with in Chapter One; that is, the main geophysical events of 1936 were stated in reading 5748-6 to be "the upheavals in the interior of the Earth." And the phrase, the greater changes apparent, probably refers to events in the interior of the Earth that would be apparent to the psychic source that communicated reading 5748-6, and also, perhaps, 311-8. To be apparent at the Earth's surface would imply perception of observable shifts in the rates and/or intensities of ongoing seismic or tectonic activities. It would take a lengthy literature search to detect any such shifts in surficial seismotectonic patterns as having occurred in 1936. A cursory check shows nothing out of the ordinary.
Thus, we have a predicament. The changes may have been too subtle for us to detect, or the date of 1936 may reflect “wavered” information as received by Cayce's conscious mind, or the source of that date (Demitrius?) may have just been wrong. If the date given had been '96, we might not have this predicament.
Can We Recognize Any Initial “Breaking Up"
Of Some Conditions in the South Pacific Today?
To quote from the reading above, are there any indications of the first breaking up of some conditions in the South Sea (that's South Pacific, to be sure)? [I am assuming here that “some conditions” refers to “some geophysical conditions.”]
In my book Coming Earth Changes (A.R.E. Press, 1996) on pages 54-58, I proposed that the seismically-active Tonga Trench was probably the area of the South Pacific that is “almost opposite” the Mediterranean or Etna area. This area is the Earth's most active zone of mantle seismicity. Its seismicity arises from the subduction of the Pacific plate at the trench. About two-thirds of global deep quakes are located here.
We will be referencing now four abstracts from Session 62C of the recent AGU meeting. They are abstract numbers S62C-1204 through 1208. No. 1204 begins by relating that “on August 19, 2002, two large deep earthquakes occurred about 7 minutes apart in the central and southern region of the deep Fiji-Tongan subduction zone, respectively. The second earthquake occurred at 680 km depth, and is, with a magnitude of M 7.7, the largest deep event in the Fiji-Tonga subduction zone ever [our emphasis] recorded".
Abstract No. 1207 states that the aftershock productivity of this second event was consistent with that of the M 7.6 quake of March 9, 1994. I had mentioned in my book (p. 55), citing D. Giardini and P. Lundgren (1995, GRL), that this 1994 quake suggested that a new mode of seismic deformation had become active in the northernmost termination of the Tonga-Fiji slab, cutting across the dense cluster of seismicity of the previous 30 years.
A subscriber asks if the August double quake in the Fiji-Tonga realm may have triggered the seismic rumblings in the Mediterranean and rising of the submerged island mentioned in the Reuters press release above. And could these events then have been followed by the robust new eruptions of Mt. Etna that began in October 2002? My answer is, this seems not to be the case, according to what geoscientists know about Earth dynamics.
But what does seem possible is that both the sensitive Mediterranean (Etna) and Fiji-Tonga regions could be the first to reflect a global acceleration in the ongoing movements of Earth's tectonic plates. This acceleration would be in response to the strains produced in Earth's crust as the poles try to begin to shift.
Consider, then, these two reports from the vicinity of the Tonga Trench. D. Millen and M. Hamburger (Geology, 1998, v. 26, pp. 659-662) report that the Pacific plate is being torn through the entire thickness of the ocean lithosphere at the northern end of the Tonga Trench. (See Fig. 7). Their data reveal a process that is apparent to geologists familiar with this region.
C. Small and D. Abbott (Geology, 1998, v. 26, pp. 795-798) recently discovered a linear trough running east-west across the seafloor in the South Pacific. It “may mark the place where Earth's outer shell has started to tear, opening up one of the freshest wounds on the surface of the globe” (Science News, 9/5/1998, p. 151). Flanked by steep ridges, the seabed canyon lies about 1600 km north-northeast of New Zealand. The authors have named this feature the Louisville Trough (Fig. 7). Their report is entitled "Subduction obstruction and the crack-up of the Pacific plate," and their thesis is that coupling between a large subducting seamount and the overriding Australian plate may serve as a mechanism to focus stresses and nucleate a rift in the subducting Pacific plate.
Are not the above two reports of the “breaking up of some conditions in the South Pacific,” now apparent, as referred to in reading 311-8?
What About New Zealand?
New Zealand is located astride one of the world's major plate boundaries. Beneath the North Island the Pacific crustal plate is being subducted under the Australian plate. Southwest of the South Island, the Pacific plate (including the South Island) is overriding the Australian plate. Between these two opposing subduction systems the plate margins are in oblique collision, and the New Zealand landmass is being twisted and torn by complex horizontal faulting and vertical movements.
This slow breaking up of New Zealand is taking place in an area of the South Pacific that's almost opposite to “the Mediterranean and Etna area.”Actually, the northeast coast of the North Island is slightly closer than the Tonga trench area that we just said was the most probable location of the South Sea breakup mentioned in reading 311-8.
Mt. Etna is located at 37.73° N, 15.00° E, and so the location in the South Pacific that is directly opposite Mt. Etna is at 37.73° S, 165.00° W, or about 1400 km (870 mi) due east of Gisbourne, on the North Island of New Zealand.
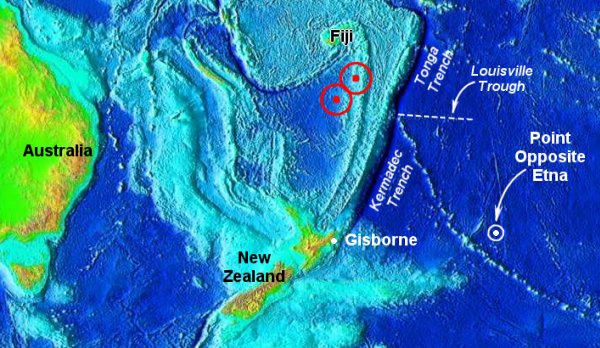 Fig. 7. Region of "breaking up" in the South Pacific that is "almost opposite" the Etna area in the Mediterranean. Locations of deep earthquakes (both M 7.7) of August 19, 2002 are shown in red rings.
And so what's going on in New Zealand relative to crustal movements just now? Here are two media releases from New Zealand's Institute of Geological and Nuclear Sciences Limited (GNS). The first deals with rapid horizontal motion of the crust of the northeastern corner of the North Island near Gisbourne.
Partial GNS News Release, 19 December 2002
Scientists Record Unprecedented Movement Of Land Near Gisborne
Scientists have recorded land near Gisborne moving about 20 mm to the east during an eight-day period in October.
The motion is thought to have been caused by movement on the boundary between two tectonic plates under the seafloor in Poverty Bay.
It is the first time that land deformation of this type has been recorded in New Zealand, although it has been observed above plate boundaries in other parts of the world in recent years.
The movement was recorded on two continuously-recording Global Positioning System (GPS) instruments, one of which was installed only five months ago, said Laura Wallace and John Beavan, geophysicists at the Institute of Geological and Nuclear Sciences Ltd (GNS).
One of the instruments is near the centre of Gisborne and the other is about 12 km west of the city.
The instrument west of Gisborne captures data from GPS satellites every 30 seconds and sends "packages" of data every hour to GNS data processing centres in Wellington and Wairakei, near Taupo. The instrument in Gisborne is run by Ian Bell, a local GPS operator.
In the months leading up to the event, the instruments showed that tectonic forces were pushing land at Gisborne slowly to the west by about 5 mm-a-year.
" It's almost like land around Gisborne sprung back slowly to the east to relieve some of the stress it was under," Dr Beavan said.
" We routinely see horizontal movement of land in numerous parts of New Zealand of 20 mm or more a year. But to see that amount of movement in eight days is extraordinary."
The sloping boundary between the Pacific and Australian tectonic plates is located about 15 km below Gisborne and gets shallower offshore in Poverty Bay.
Earthquakes occur occasionally at plate boundaries throughout the world as the two plates stick together for many years and then suddenly slip past each other.
Scientists believe that the movement at Gisborne may have been caused by a "slow earthquake" where the two sides of the plate interface slipped past each other by about 20 cm. However, the slip took place much more slowly than in a normal earthquake, so did not cause the shaking and damage of a normal quake.
"At this stage, all we can say for certain is that an unknown area of land on the North Island's east coast moved quite rapidly to the east by about 20 mm during mid-October. With more GPS stations in the North Island, we'd be able to say with more certainty how much of the North Island was affected," Dr Beavan said."
The second GNS media release deals with vertical motions of the Taupo volcano region, also on the North Island. Taupo is a volcano that is one of the potentially super-eruptive volcanoes that we monitor. (See the THC Earth Change News page)
Relative motions of the plates beneath New Zealand have produced a rugged topography and active volcanoes. North Island's Ruapehu volcano exploded spectacularly in September 1995. Ruapehu is the major ski resort of the island, attracting 10,000 skiers on some days. But the eruptions that continued into October 1995 produced mud flows, emptied a large lake, and dispersed a large volume of ash and scoria bombs downwind.
As for earthquakes, a 1848 temblor was violent on both sides of the Cook strait, and resulted in fissures and fresh scarps in the Atwatere Valley. Wellington, the capital, was seriously damaged in the quake of 1855, and country to the west was generally uplifted from three to ten feet.
Partial GNS Media Release, 6 June 2002
Taupo Rising And Falling Faster Than Other Parts Of New Zealand
Parts of the Taupo region have risen and fallen by up to 7 centimetres over 10 years, scientists have found in a long-term study of the area.
The vertical movements, or deformation, are a direct result of Taupo's location which spans an active caldera volcano and a volcanic rift system where tectonic forces are pulling the earth's surface apart by several millimetres a year.
Published in the New Zealand Journal of Geology & Geophysics, the report is a summary of data from 22 measuring stations around the edge of the 600 sq km lake, and along a belt of active faults north-east of Taupo Although vertical movement data from other parts of New Zealand is sparse, it is thought that movements at Taupo are probably unrivalled in their rates and complexity.
Volcano surveillance co-ordinator, and joint author of the report, Brad Scott, said the data showed parts rising steadily for several years then stopping abruptly, and sometimes even reversing direction.
Mr Scott said the observations provided a valuable insight into the underlying dynamics in a region undergoing "continuous extension, frequent earthquake swarms, and occasional volcanism."
Scientists observed four distinct periods of deformation during the 20-year study. The first was a four-year phase when they observed steady subsidence in the Taupo Fault Belt, north-east of Taupo.
The second episode started in 1983 and consisted of rapid uplift in the Taupo Fault Belt. During the third phase, between 1984 and 1996, the Taupo Fault Belt subsided again at an average rate of 11mm a year.
The final episode, between 1996 and 1999, featured uplift at the south-east shores of Lake Taupo.
Summary
If the motions of Earth's tectonic plates are beginning to speed up in response to an approaching pole shift, we should definitely be able to see the consequences of such activity now. The consequences should be apparent first in seismically and tectonically sensitive places like New Zealand and the Tonga trench and associated South Pacific sea-floor near the point opposite Mt. Etna. On the opposite side of the planet, in the Mediterranean (Etna) area, we could expect to see evidence of plate-motion acceleration in the pulsation of the sea-floor off Sicily and the rising or sinking of Sicily itself.4
There is nothing quite so convincing of the predictive strength of reading 311-8 as observing an island rising out of the Mediterranean Sea in the Etna area, while at the same time perceiving the breaking up of geological conditions in the South Pacific. We can only conclude, therefore, that "the changes in the Earth's activity" have begun to be apparent.
-
Quoting excerpts from the volume of abstracts must follow stringent AGU requirements. Also, AGU's abstract citation format is rather cumbersome. It requires a complete citation for each abstract quoted. I'm going to adjust this requirement as follows. Each time I cite an abstract number it will be understood that the abstract was published in EOS, Trans. AGU, 83 (47), Fall Meet. Suppl., Abstracts, 2002.
-
The preceding three paragraphs are adapted from a National Science Foundation press release dated 11/29/2001.
-
One can quibble over this definition of the arctic region's limit, but it is close to the one given in Webster's Geographical Dictionary (1949, p. 60). We likewise use 61° S as the parallel of latitude for the northernmost limit of the antarctic region. This latitude encompasses all of the continent of Antarctica.
-
In Coming Earth Changes (1996, A.R.E. Press), I mentioned (p. 54) a report by C. Firth, and others, entitled "Coastal elevation changes in eastern Sicily: implications for volcano instability at Mount Etna." These authors concluded that radiocarbon-dated remains indicate that the volcanic coast of Sicily, from Catania to Capo Schiso, and the northeastern shoreline, from Taormina to Milazzo, "have been uplifted at a rate exceeding 1.5 mm per year during Holocene times [roughly the last 10,000 years], although more recent rates of uplift may have been greater." A bit further away on the island of Ischia (Fig. 5), S. Alessandro and P. Imbriani state in their paper, "Recent Uplift of Ischia, Southern Italy," that "historical evidence suggests that during the last two millennia parts of the north coast were submerged by up to 4 meters whereas the southern coast underwent as much as 25 m [82 ft] of emergence."