
Earth Change Monitors
Chandler's Wobble Monitor
Chandler's Wobble is named for the apparent "wobbling" motion that the Earth's polar axis makes over a period of about 11/5 years (443 days). In that time period, if the imaginary point on the Earth's surface where the polar axis appears to radiate upward were plotted, the daily changes in position would plot out a near circle. The beginning and endpoints would be close to each other, but would not quite connect. If one was to continue to trace the poles daily positions over a time period of years, one would find that in fact the path followed a continuous spiral. First spiraling in, then spiraling outward to a maximum diameter of about 40 feet, and then spiraling back inwards again. This pattern has held true since the North Pole's precise position began to be determined in 1846. One can observe the pole's past movements by looking at the animated plots in the Historical Animated Pole Plots section.
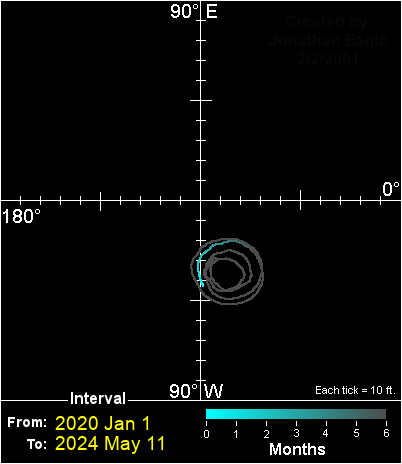
The graphic to the right shows a plot of the polar motion of Earth's rotational axis over a four to five year time span. The point at which the white axes cross in the middle of the image represent the geodetic North Pole. The gray spiral ending in an aqua colored tail is the "Chandler's Wobble" of the Earth's north polar axis for the time period indicated at the bottom left of the image. The brightest cyan dot at the end of the spiral is the position of Earth's rotational axis, or "North Pole" on the 'To:' date. Each day the Earth's actual rotational axis moves anywhere from a few inches to over a yard.
One can gauge distance by comparing the length of a segment of the spiral to the tick marks on the white axes. Each tick represents a distance of 10 feet. The velocity of the motion over the last six months can be estimated by the length of the aqua line as it fades to gray. The longer that that segment is the faster the pole is moving.
By comparing the current path of Chandler's Wobble to the historic motion of the pole (see the Historical Animated Pole Plots section) one can see that the historic motion of Chandler's Wobble occurs in a similarly limited area, much as the present Chandler's Wobble graphics show. Should the Earth's axis begin to shift you can expect to see dramatic evidence of it in the pole's position as shown in our daily depiction of Chandler's Wobble.